RESEARCH UPDATE: Change detection and prediction: understanding the dynamics and structural shifts in diagnosed cases of fascioliasis in Scottish livestock
Reviewers: Davide Pagnossin
EPIC_202627_RU_001
DOI: 10.5281/zenodo.21702035
Executive Summary
Changes in disease incidence are often inevitable, stochastic and heterogeneous in time and space. This is because disease incidence is influenced by climatic, ecological, production, and management factors that are themselves variable in time and space. Integral to disease surveillance intelligence is the ability to monitor, detect, quantify and predict these changes.
We demonstrate the application of innovative approaches for detecting, quantifying and predicting how disease counts change over time. As an exemplar, we looked at data from Scotland’s Rural College (SRUC) Veterinary Services on diagnosed cases of liver fluke infections (fascioliasis) in sheep and cattle between 2002 and 2020. While we focused on liver fluke for this study, these same methods can be used to study many other diseases that are regularly found in livestock.
Changes in disease incidence over time were quantified. Periods of significant structural shifts in the disease dynamics were identified. These structural changes in incidence coincide with some known epidemiological events and with changes in the surveillance system. The best predictive model was used to estimate the shape of the seasonal and trend patterns and predict the fluctuations in the monthly number of diagnosed cases of fascioliasis. There were differences in the seasonal peaks between sheep and cattle and between the disease severity (acute and chronic fascioliasis in sheep). Note: Acute and chronic cases in sheep were combined to produce the results presented in Figures 1 & 2 of this brief.
Studying the past helps us understand how past events shape the present, providing background information that can be used to make predictions about the future. Fascioliasis does not spread directly from one affected animal to another, and the life cycle of the causative agent heavily depends on environmental temperatures and humidity. Further, this pathogen has a wildlife reservoir, therefore treatment of livestock will not reliably control the risk of infection year on year. Together with the variation of disease presentation in different species, fasciolosis is not only a valuable disease to track over time to assess ecological changes but also one where a reliable prediction of disease incidence can make a significant contribution to its control.
- Quantify the relative monthly and yearly changes in diagnosed cases of fascioliasis in Scottish cattle and sheep between 2002 and 2020
- Investigate if there were fundamental changes in the disease dynamics over the study period
- Identify the time period(s) coinciding with the structural changes in the disease dynamics
- Model and compare the temporal patterns of the number of diagnosed fascioliasis cases in cattle and sheep
- Develop and compare predictive models constructed based on different forms of relationships between temporal factors and fascioliasis case counts
Select the best model and use it to predict the number of fascioliasis cases for each time point
- For both acute and chronic cases in sheep, 2012 had the highest relative increase in average number of diagnosed cases of fascioliasis, while for cattle this occurred in 2013.
- The highest change in monthly diagnosed cases in sheep was observed consecutively from November 2012 to January 2013, with rates ranging from 5.5 to 7.0 times the average monthly diagnosis. In cattle this increase in monthly cases occurred a few months later; from January to May 2013 consecutively, with rates ranging from 3.0 to 3.3 times the monthly average.
- Rates were highest for acute cases in sheep between October and December 2012 where rates were 10.5 to 19.4 times the mean monthly acute diagnosis.
- The sustained increase in case counts for consecutive months suggest that changes in diagnosis were not random events but attributable to epidemiological events.
- These high rates of change coincide with known periods of high rainfall events.
- Significant step changes in mean case levels occurred at approximately the same time-period for both sheep and cattle, but episodic changes seemed to occur earlier in sheep than cattle (Fig 1).
- The collapse in the structure of mean case levels in sheep and cattle observed between 2018 and 2020 may be due to changes in the surveillance system, Brexit, and the effects of the Covid pandemic and associated restrictions (Fig 1).
- For both livestock species, cases were lower in summer months and highest between late autumn and early spring.
- As expected from the epidemiology of fascioliasis, acute cases in sheep occurred four months earlier than chronic cases. The difference in the pathogenesis between the two species studied will further have led to the seasonal peak of diagnosed cases in sheep to have occurred earlier than in cattle.
- The best predictive model accounted for, on average, about 73% of the total variation in the monthly number of diagnosed cases and predicted likely future number of cases with high accuracy.
- The model closely predicted the fluctuations in monthly case numbers over the nineteen-year period (Fig 2).
Data used in this study are based on voluntary submissions. Therefore, diagnosed case numbers are dependent on the willingness and propensity of farmers and vets to submit samples and other factors that affect the ability to use the SRUC VS. Consequently, data analysed in this study are a subset of all fascioliasis cases in Scotland. Despite this limitation, the data capture known temporal characteristics of fascioliasis in sheep and cattle, hence, they are sufficient for the purpose of this study.
This work was done between October 2025 and 31 March 2026 in fulfilment of Deliverable 3.2.3.9
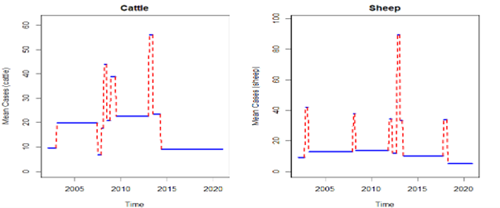
Fig. 1: Mean number of cases at each detected change point segements (blue) depicting time of structural shifts in the incidence of diagnosed cases of fascioliasis in cattle and sheep between 2002 and 2020.
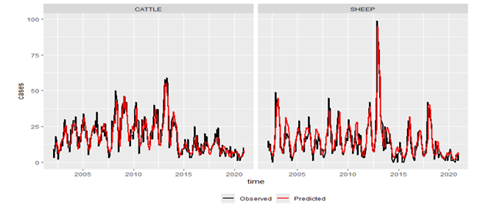
Fig. 2: Observed (black) and predicted (red) monthly number of diagnosed fasciolosis cases in cattle and sheep. Predictions were obtained using the best of the seven models.

